
- Tags
- investment, Market briefing
- Date
- 24, OCT 2024
Market Briefing October – The Magnificent Seven
Resources
Read our October version of Market Briefing – The Magnificent Seven – Will their growth continue?
Labour honeymoon over
Some might say that after winning a historic landslide, Keir Starmer and his Labour government would get at least 100 days’ worth of political honeymoon. But many Labour supporters are now asking where did it all go wrong?
Accusations of sleaze in the gifting of clothes, use of donors’ property for official reasons, whilst making the winter fuel allowance means tested, have all contributed to Labour’s new government perhaps feeling they have started on the back foot.
Depending on your sport of choice, in what many consider to be a series of unforced errors or own goals, Labour’s first government in fourteen years now finds itself well and truly behind the eight ball!
Time will tell whether all the things they said in the general election campaign will slowly fade away.
Oasis announces reunion tour
The Oasis reunion tour is one of the most highly anticipated tours by a British rock band ever. Known for hits like ‘Wonderwall’ and ‘Champagne Supernova,’ Oasis was one of the defining acts of the Britpop era in the 1990s, fronted by the Gallagher brothers, Liam and Noel.
Tensions between the two brothers had been the primary barrier to a reunion. After their volatile relationship culminated in a backstage fight in 2009, Noel left the band, leading to its breakup. Since then, both brothers have pursued solo careers: Noel formed Noel Gallagher’s ‘High Flying Birds’, while Liam launched a solo career and later revived ‘Beady Eye’, a band formed with other Oasis members.
Rumours of an Oasis reunion have persisted for years, fuelled by media speculation and occasional comments from the Gallagher brothers. Liam has often expressed interest in reuniting, but Noel has been more reluctant, frequently dismissing the idea in interviews. The possibility of a reunion gained momentum in 2023 when Liam hinted on social media that Noel had reached out about a potential tour. All around the world, the tour will allow a new generation of fans to experience the band live, while also delivering nostalgia for those who followed Oasis during their 1990s heyday.
Perhaps taking inspiration from their ‘Don’t look back in anger’ song title, the Oasis reunion tour is undoubtedly one of the biggest events in rock music, certainly in the 21st Century, with massive global demand for tickets. However, focusing on Oasis doesn’t mean they’re the only show in town. Other bands are available and to concentrate on them only would mean risking missing out on some other great bands. Which brings us onto another concentration risk … in investing …
Concentration risk – sounds uninteresting but mitigating it is vital for investors
Concentration risk in investing refers to the potential for a portfolio to suffer significant losses due to a heavy allocation in a single investment, asset class, or market sector. This risk arises when an investor’s holdings are not sufficiently diversified, making the portfolio vulnerable to adverse developments affecting the concentrated investments. Here are some key aspects of concentration risk:
Single stock risk
If a large portion of the portfolio is invested in a single company’s stock, the investor is highly exposed to that company’s performance. If the company experiences difficulties, the portfolio could incur substantial losses. On the other hand, maybe one of the investments has performed very well relative to the rest of the portfolio. For instance, in a bull market, you might find that stock holdings – or even just a handful of holdings – now represent a significantly greater percentage of a portfolio than before since your stocks have gained more value.
Sector risk
Concentrating investments in one particular industry or sector can lead to significant exposure to that sector’s risks. For example, if a portfolio is heavily weighted in technology stocks, it would be significantly impacted by negative developments in the tech industry.
Geographical risk
Investing predominantly in a single country or region exposes the portfolio to risks specific to that area, such as political instability, economic downturns, or regulatory changes. For example, a successful geographical sector may begin to make up a disproportionately large proportion of an investor’s portfolio due to the returns from that area, making them susceptible to the individual whims of that geographical sector.
Asset class risk
A lack of diversification across different asset classes (such as stocks, bonds, and property) can lead to increased risk. For instance, a portfolio solely composed of stocks may be more volatile than one that includes a mix of asset classes. For example, concentration due to correlated assets, i.e. investments within the same industry, geographic region or security type, likely would mean that what happens to one investment is likely to happen to the others. An investor might have investments in individual technology companies but also own a technology fund and have technology stocks represented in an index fund they own.
The ‘magnificent seven’
Clearly a play on the 1960 and 2016 films of the same name – which in themselves were Hollywood’s take on a 1954 Japanese film ‘Seven Samurai’ – the ‘magnificent seven’ includes Alphabet (Google), Amazon, Apple, Meta (Facebook), Microsoft, Nvidia, and Tesla. These ‘mag seven’ were responsible for approximately 60% of the leading US stock markets circa 26% return in 2023. While these seven stocks surged by over 100% over the year, the remaining 495 companies in the Index saw a much smaller gain of 12.5%. Notably, Nvidia was one of the standout performers, climbing over 85% in the first quarter of 2024 after a massive 230%+ rise in 2023.
So what?
Driven by a fear of missing out (FOMO) on these exceptional gains, investors have been pouring money into tech-focused funds. Data shows that fund flows (1) in technology funds for the first half of 2024 were around 9 times (2) more in terms of US$s than the second most popular asset type. However, this isn’t the first time a select group of companies has captured investors’ enthusiasm. So, what lessons can we learn from the rise and fall of previous market favourites?
To put the above numbers in context, collectively, these companies have a combined market value capitalisation exceeding the economies of the UK, France, Germany, and Italy combined!
The ‘Nifty-Fifty’
In the 1960s and early 1970s, a select group of stocks known as the ‘Nifty Fifty’ captured the imagination of investors. These 50 companies were considered ‘blue-chip’ stocks – firms with strong earnings growth, dominant market positions, and supposedly limitless potential. The Nifty Fifty Investors were willing to pay premium prices for these stocks, believing they could do no wrong.
The Nifty Fifty were large-cap growth stocks, and included household names like IBM, Coca-Cola, McDonald’s, Xerox, Polaroid, Johnson & Johnson, Disney, and PepsiCo; all were considered untouchable giants and deemed virtually recession-proof due to their consistent earnings growth and market dominance. Many of these companies had become ingrained in American culture, expanding rapidly both domestically and internationally. Investors believed they were long-term ‘buy-and-hold’ stocks, with no need to worry about timing the market. As a result, many Nifty Fifty stocks traded at extremely high price-to-earnings (P/E) ratios, some as high as 50- or 60-times earnings – well above historical averages.
Boom of the late 1960s and early 1970s
The underlying assumption was that these companies’ earnings growth would continue indefinitely, justifying their high valuations. As they were seen as less risky, institutional investors, pension funds, and individuals alike poured money into these stocks, driving prices higher. Investment advisers and Wall Street analysts continued touting the idea that these companies were so powerful that their stock prices would only keep rising. This belief was fuelled by optimism surrounding technological innovation, consumer demand, and globalisation, which positioned many of these companies for long-term success.
The market unravels in the 1970s
However, the collapse of the Nifty Fifty serves as a cautionary tale about market exuberance, valuation risk, and the importance of diversification. By the mid-1970s, the situation took a drastic turn. Several factors contributed to the downfall of the Nifty Fifty.
Overvaluation
Many of the Nifty Fifty stocks were trading at P/E ratios far above the broader market. As the stock market entered a downturn in the 1970s, these high valuations came under scrutiny. Investors began to realize that no company could sustain perpetual growth, and the stocks were priced for perfection.
Economic shocks
The early 1970s were marked by significant economic challenges, including the 1973 oil crisis, rising inflation, and a deep recession.
These macroeconomic factors hurt consumer demand and business investment, leading to falling profits across many sectors, including some of the ‘untouchable’ Nifty Fifty companies.
Earnings disappointments
As economic conditions worsened, many Nifty Fifty companies failed to meet the lofty earnings expectations baked into their stock prices. Companies like Polaroid and Xerox, once seen as innovative leaders, struggled to maintain their competitive edge and profit growth. This led to sharp corrections in their stock prices.
Rising interest rates
The US Fed (Federal Reserve) raised interest rates to combat inflation, making it more expensive for companies to borrow and invest in growth initiatives. Higher interest rates also made bonds more attractive relative to stocks, reducing the appeal of high-growth, high-valuation companies like those in the Nifty Fifty.
The broader stock market experienced significant declines during the bear market of 1973-1974, and the Nifty Fifty stocks were no exception. Many of them saw their stock prices plummet by 50% or more, with some never recovering. Polaroid, once a market darling, eventually went bankrupt. Xerox, despite its early dominance in photocopying, faced growing competition and lost its technological edge.
‘Dotcom’ bubble
The dotcom bust of the early 2000s remains one of the most infamous episodes in financial history, illustrating the perils of speculative bubbles and the dangers of irrational exuberance in the stock market. During the late 1990s, internet-based companies – often called ‘dotcoms’ – experienced meteoric rises in stock prices as investors bet on the future of the internet. However, this speculative frenzy came to a sudden and devastating halt in 2000, wiping out billions of dollars in wealth and reshaping the technology industry. The dotcom bust provides important lessons for investors about the risks of speculative investing, overvaluation, and the need for a solid business model.
The rise of the dotcom era
In the mid-1990s, the rise of the internet revolutionized industries and sparked unprecedented excitement about the possibilities of a connected, digital future. E-commerce, digital media, and online services were viewed as the next big thing, with the potential to disrupt traditional businesses and create entirely new industries.
Investors and entrepreneurs alike were drawn to the allure of the ‘new economy,’ where traditional metrics like earnings, profits, and cash flow seemed irrelevant. The belief was that internet-based companies could grow at astronomical rates, even if they were not yet profitable. Venture capitalists poured money into dot-com startups, while Wall Street investment banks eagerly took these companies public.
Companies like Amazon, Yahoo!, and eBay became stock market darlings, with their share prices soaring on the promise of future profits. Even companies with little to no revenue were able to attract massive investments, simply by adding ‘.com’ to their names or pivoting their business models to align with the internet boom. This speculative fervour drove stock prices higher, as everyone from institutional investors to individual day traders wanted a piece of the action.
The excitement reached a fever pitch, with media outlets and financial pundits hailing the ‘new economy’ and suggesting that old valuation methods no longer applied. The traditional business models of brick-and-mortar companies were seen as obsolete, and internet companies were considered the future. Investors believed that the internet would revolutionise every aspect of commerce and communication, leading to unlimited growth potential.
Cracks begin to happen
Despite the optimism, there were warning signs that the dotcom bubble was unsustainable.
Lack of profitable business models
Many of the companies going public during this period had little to no revenue, let alone profits. They were focused on rapid growth, often burning through cash to acquire customers, build brand recognition or expand their services without a clear path to profitability.
Unsustainable valuations
Stock prices became disconnected from the fundamental value of the underlying businesses. Companies were being valued based on ‘eyeballs’ (website visitors) or potential future revenue rather than tangible earnings.
Excessive speculation
Day trading and speculation fuelled the rise of dotcom stocks. Many amateur investors were buying stocks simply because of the hype, with little understanding of the companies’ actual business models. This speculative trading led to wild price swings and inflated valuations.
Over-dependence on venture capital
Many dotcom companies were reliant on venture capital funding to sustain operations. As these companies went public, the pressure to deliver results grew, but many lacked the financial discipline or business strategies to turn a profit.
Bubble bursts
The bubble finally burst in March 2000. Several factors contributed to the collapse.
Rising interest rates
The Federal Reserve, concerned about overheating in the economy and rising inflation, began raising interest rates. Higher rates made it more expensive for companies to borrow and investors to speculate, leading to a re-evaluation of stock prices.
Profit warnings
By early 2000, several high-profile tech companies began issuing profit warnings, revealing that their businesses were not growing as fast as anticipated. This led to a reassessment of the sector’s growth prospects.
Market sentiment shift
As cracks in the dotcom narrative appeared, market sentiment quickly shifted. Investors, who had previously been willing to overlook the lack of profits, began selling off their shares, triggering a cascade of declining stock prices.
An Index focused on dotcom/tech stocks, peaked at 5,048 in March 2000, and plummeted by almost 80% over the next two years, reaching a low of 1,114 in October 2002. Hundreds of dotcom companies collapsed, wiping out trillions of US$ in market value. Companies like Pets.com, Webvan, and eToys, which had once been the poster children of the internet boom, went bankrupt. Even established companies like Amazon and Yahoo! saw their stock prices drop by over 90%.
Whilst always accepting that past performance is no guide to future returns, Mark Twain’s famous quote that ‘history doesn’t repeat itself, but it often rhymes’, is absolutely appropriate as we draw parallels from the examples of the Nifty-Fifty and Dotcom bubbles.
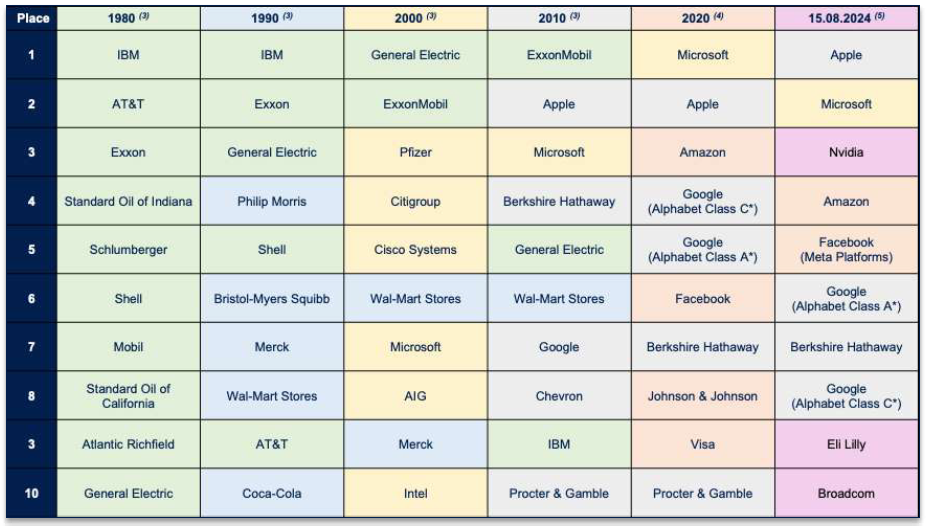
The table below shows the top ten stocks at the beginning of each decade in the leading US index, finishing with the latest available data in mid-August this year.
What should you be thinking about concentration risk?
What the above shows
1980 – None of the companies in the top ten in 1980 retained its place in 2024. In fact, the longest lasting were ExxonMobil, General Electric and IBM, all of which had fallen out by the 2010s.
1990 – None of the companies who were new to the top ten in 1990 has retained their place by 2024. In fact, Wal-Mart was the last, and it fell out of the top ten by the 2010s.
2000 – Only one company that was new to the top ten at the beginning of the millennium has retained its top ten place in 2024; Microsoft.
2010 – Only three companies new to the top ten in 2010 – Apple, Google and Berkshire Hathaway – appear in the top ten in 2024.
2020 – Only two companies new to the top ten in 2020 – Amazon and Facebook – retained their place four years later in 2024.
2024 – Three new entries appear this year – Nvidia, Eli Lilly and Broadcom. Time will tell if they can retain their top ten place, and for how long.
So what?
The ‘Nifty Fifty’ and ‘Dotcom’ examples above provide a powerful reminder of the dangers of market euphoria and the risks of overpaying for perceived ‘sure bets.’
The dotcom bust was an especially poignant and painful reminder that even revolutionary technologies like the internet cannot escape the realities of financial markets. While the internet did transform the world in profound ways, the market’s initial expectations were overly optimistic. The lessons of the dotcom bust are more relevant than ever, particularly as investors navigate new technologies like artificial intelligence, cryptocurrencies, and the rise of tech giants. Keeping a focus on fundamentals, understanding valuations, and avoiding speculative manias remain essential principles for long-term investing success.
Returning to today, parallels are often drawn between the ‘Nifty Fifty’ and ‘Dotcom’ examples with modern-day tech giants like the ‘Magnificent Seven’. While these companies may dominate the market currently, as shown in the table above, the lessons of the past show that no stock is immune to broader market forces, and prudent investors should remain mindful of valuation, diversification, and long-term risk management.
So investors can take away two key lessons from both the ‘Nifty Fifty’ and ‘Dotcom’ bubbles. First, the future is often far less predictable than it seems. Second, even a great company can become a bad investment if its stock is overpriced.
It’s also worth noting that by the end of the 1960 ‘Magnificent Seven’ film **spoiler alert**, four of the seven gunslingers hired to protect the village died (only Chris, Vin and Chico survived!) While this doesn’t imply that four of today’s top-performing US stocks will meet a similar fate, history does offer important insights into the risks of chasing the latest market trends. As the old man says in the film’s final scenes, the Magnificent Seven are ‘like the wind, blowing over the land and passing on.’ The same can be said of stock markets and so hopefully investors won’t ‘look back in anger’.
Click here to download a copy of this Market Briefing
In October … (6)

Sources
- Fund flow is the cash that flows into and out of various financial assets for specific periods of time. It’s usually measured on a monthly or quarterly basis – https://www.investopedia.com/terms/f/fund-flow.asp
- https://www.lpl.com/research/blog/a-deep-dive-into-2024s-fund-flow-activity.html
- https://etfdb.com/history-of-the-s-and-p-500/#1990
- https://www.investopedia.com/articles/investing/053116/10-largest-holdings-sp-500-aaplamznfb.asp
- https://www.investopedia.com/best-25-sp500-stocks-8550793
- https://www.onthisday.com
This publication is marketing material. It is for information purposes only. This statement is for the sole use of the recipient to whom it has been directly delivered by their Foster Denovo Partner and should not be reproduced, copied or made available to others. The information presented herein is for illustrative purposes only and does not provide sufficient information on which to make an informed investment decision.
This document is not intended and should not be construed as an offer, solicitation, or recommendation to buy or sell any specific investments or participate in any investment (or other) strategy. Potential investors will have sought advice concerning the suitability of any investment from their Foster Denovo Partner. Potential investors should be aware that past performance is not an indication of future performance and the value of investments, and the income derived from them, may fluctuate and they may not receive back the amount they originally invested. The tax treatment of investments depends on each investor’s individual circumstances and is subject to changes in tax legislation.
Secondsight is a trading name of Foster Denovo Limited, which is authorised and regulated by the Financial Conduct Authority Registration No: 462728.
Registered office:Foster Denovo Limited, Ruxley House, 2 Hamm Moor Lane, Addlestone, Surrey, KT15 2SA. Phone: 01932 870 720 Email: info@fosterdenovo.com Website: www.fosterdenovo.com | MB61151024